Would you like to change to Spanish?

Vamos No
Career Plan Template: define technical competencies, soft skills and leveling easily. Download
Engagement

Employee turnover seen before it happens

Attrition risk by team and by person, the reasons behind every exit and the climate context, so you act in time and not with the resignation letter on the table.

G2 4.720,000+ users
Employee turnoverLast 12 months · 54 active employees
Nailted AI
11%Annual turnover
7%Voluntary
2Teams at risk
9Leavers
Attrition risk by team
Sales & CSHigh+8 pts
MarketingMedium=
Tech & ProductLow−3 pts
Share with leadershipDashboard shared with the leadership team
InditexCabifyCalidad PascualFeverWiZinkJob&TalentSngularCarto

Spot which teams are at risk

Every group has its own situation. Compare attrition risk by department, office or tenure and act where it matters most.

  • Risk by department, office or tenure
  • Risk trend over time
  • Comparison between teams
Risk by tenure
Less than 1 yearLow12 people
1 to 3 yearsHigh24 people
More than 3 yearsLow18 people

Act before someone leaves

Nailted AI estimates each person's likelihood of leaving so their manager and HR can act in time, with a conversation or a plan.

  • Individual likelihood of leaving
  • Visible only to people with permission
  • Follow-up in the 1:1
People to watch · Sales & CSPermission only
MSMateo S.2 years · no 1:1 in 6 weeksHigh likelihood
RLRebeca L.Asked to discuss her next levelMedium likelihood
Suggested next stepSchedule a 1:1 with Mateo this week
1:1

Understand why people leave

Turnover and its causes in one dashboard, with the context of climate and the exit survey, so you know whether your initiatives are working.

  • Voluntary and involuntary turnover
  • Reasons for leaving
  • Anonymous exit survey
Reasons for leaving · last 12 months
Career growth444%
Salary222%
Relationship with manager222%
Personal reasons111%

Present it to leadership in one click

Share the analysis with managers or the leadership team in a clear, visual way, without preparing slides.

  • Shareable dashboards
  • Quarterly turnover trend
  • Data to decide where to invest
Leadership report · Q3 retentionShare
14%Q4 25
13%Q1 26
12%Q2 26
11%Q3 26

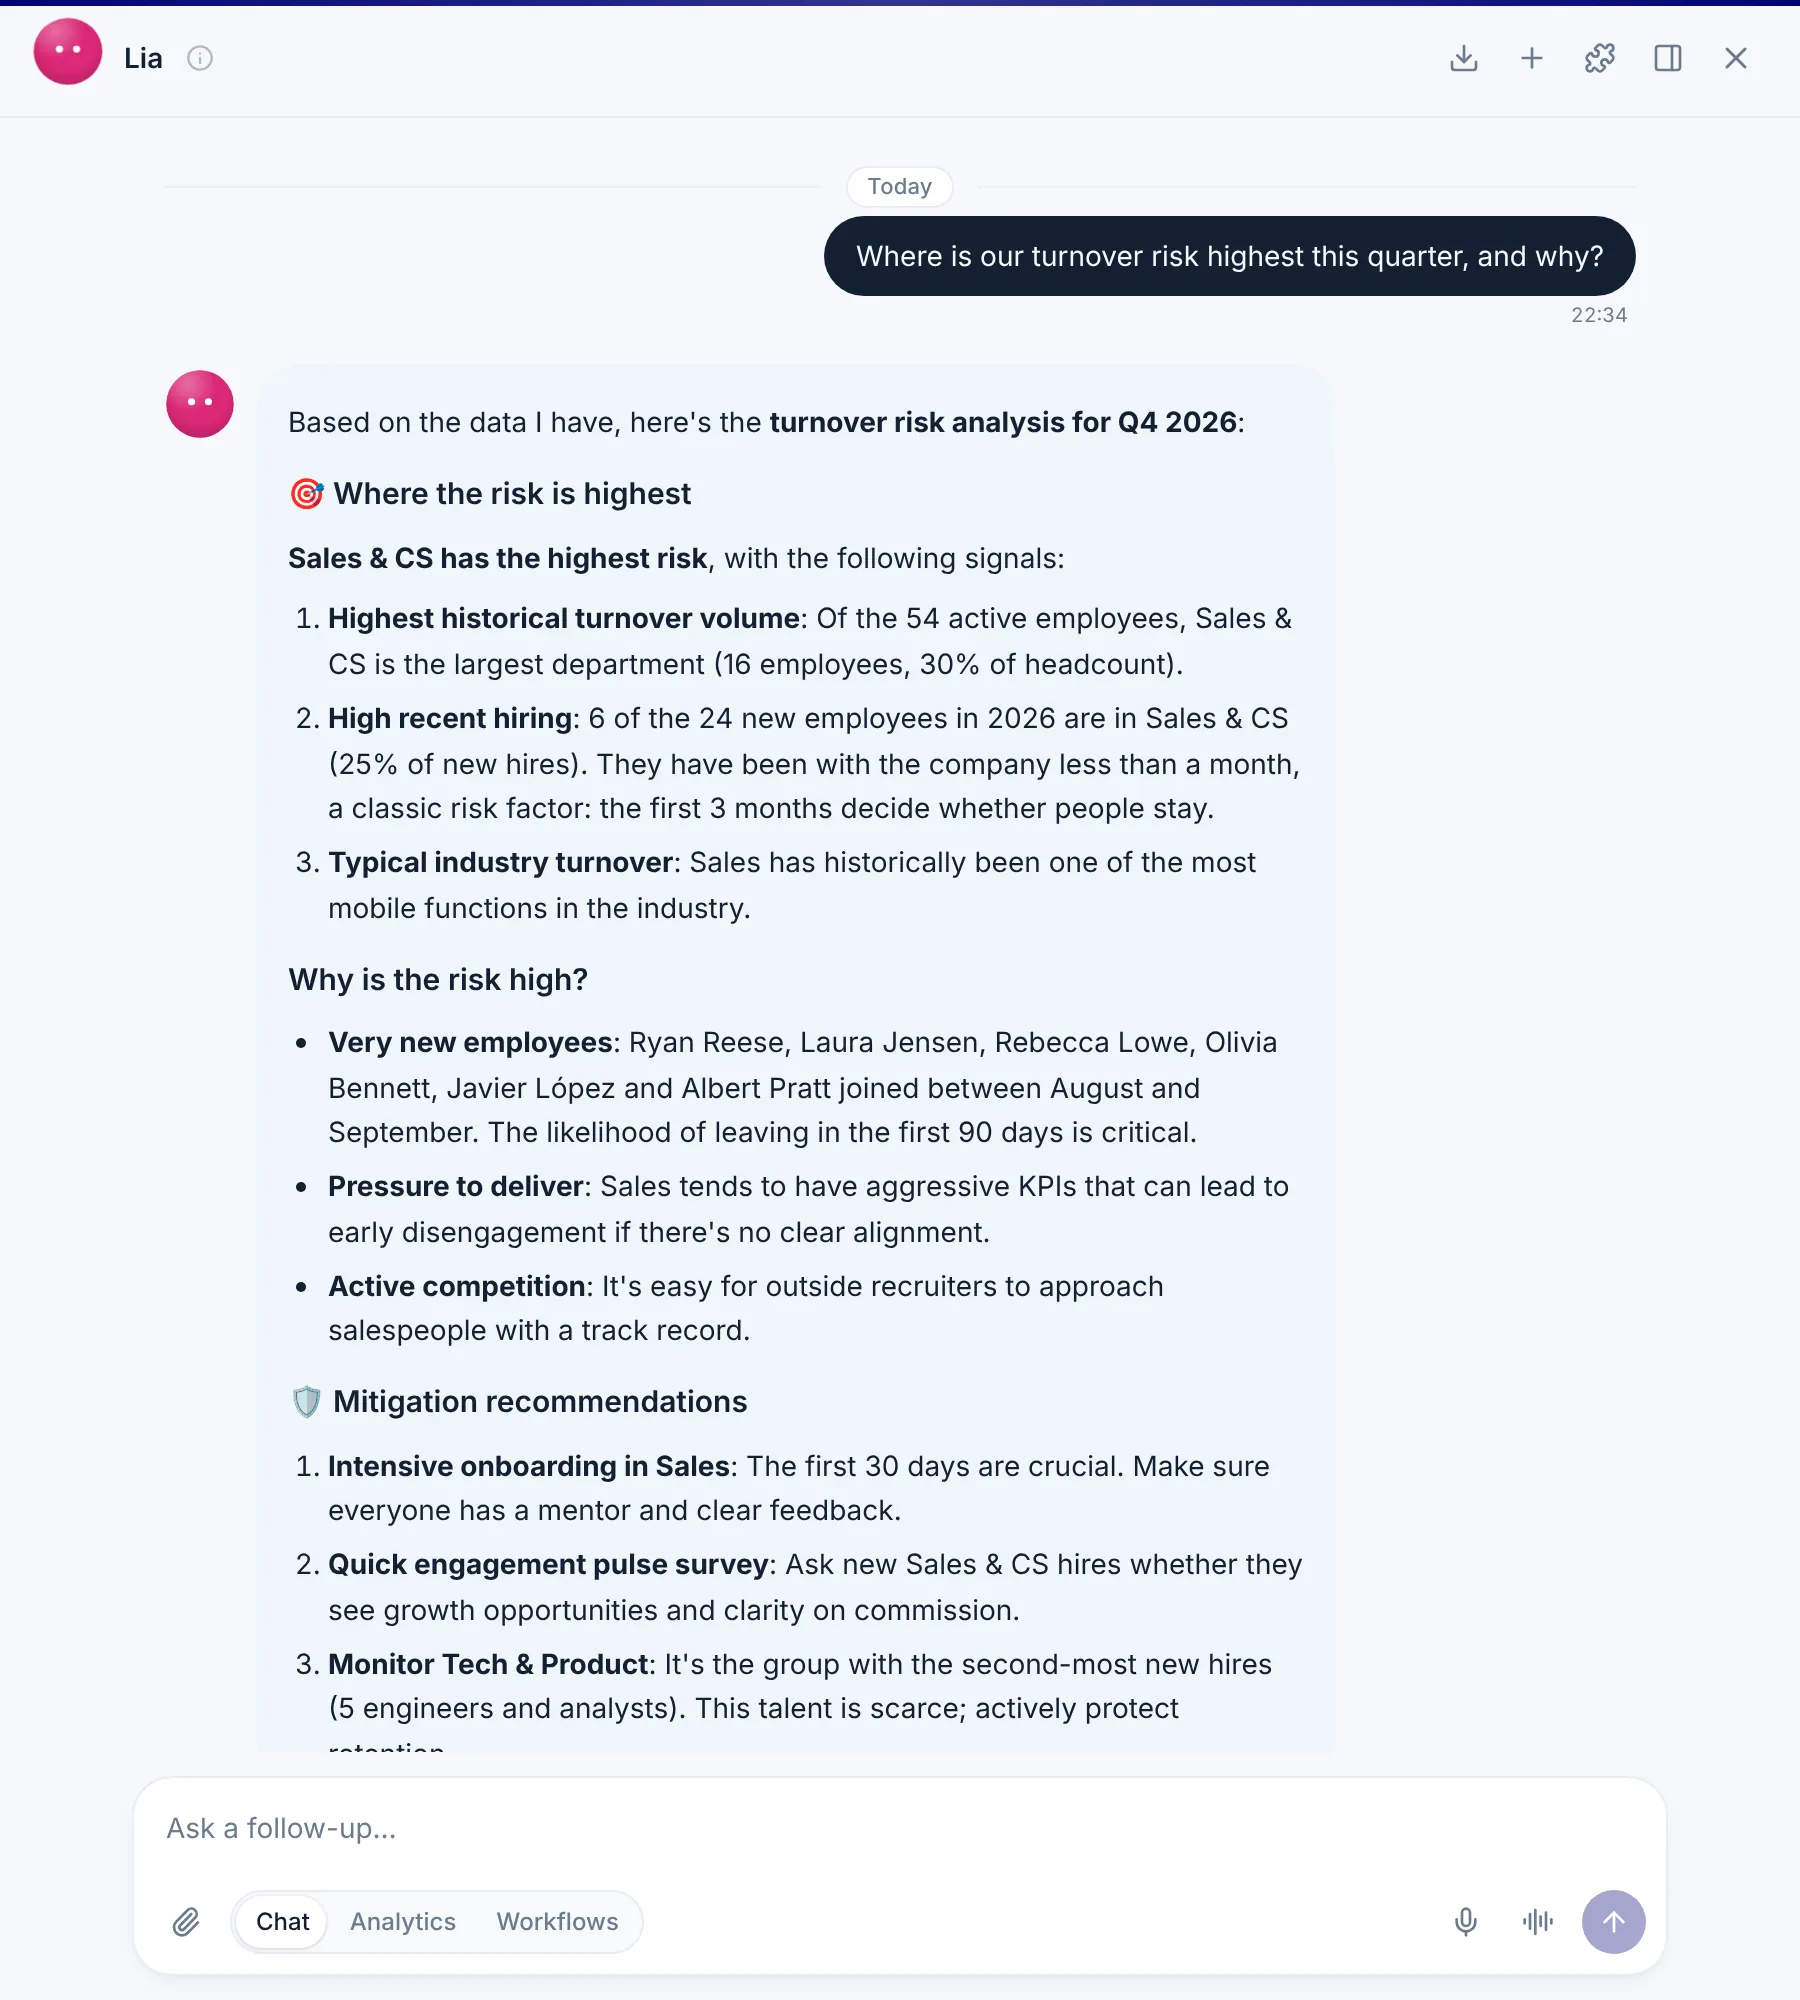
Ask where the risk is

The agents cross risk with climate and tenure, and tell you which teams to look at and what to do first.

Everything it includes

Prediction3 features
  • Risk by group
  • Individual likelihood
  • Risk trend
Turnover3 features
  • Voluntary and involuntary
  • By team and tenure
  • Reasons for leaving
Context3 features
  • Climate and engagement
  • Exit survey
  • Onboarding pulses
Privacy3 features
  • Permission-based access
  • Anonymous group data
  • GDPR compliance

Frequently asked questions

How does Nailted predict turnover?

Nailted AI analyzes trends in your company's data, such as climate and participation, to estimate attrition risk by group and by person.

Who sees each person's attrition risk?

Only people with permission. Climate data is always shown by group and with a minimum number of responses.

Can I see why people leave?

Yes. The turnover dashboard captures the reasons for leaving, and the exit survey adds context from each person who leaves.

Can I compare teams or offices?

Yes. You can see risk and turnover by department, office, tenure or any profile attribute.

What do I do when I spot a risk?

Usually, start with a conversation in the 1:1 and review the person's career path. Nailted helps you follow up.

See how to get ahead of turnover

A demo tailored to what you want to solve. No commitment.